Smart Statistics: A research tool for data analysis and visualization
This section presents the key objectives, features and the operational manual of the software. It is recommended to go through this thoroughly before starting with the application. if you have already read it, kindly skip to the bottom of the page to continue with the software.
Key objectives:
- Smart Statistics is a no-code online statistical tool for data analysis and visualization designed to provide a user interactive experience to all researchers in the field of bio-medical, pharmaceuticals, business, operation management and experiment based studies.
- The software is able to perform complex statistical analysis like hypothesis testing, regression analysis, interpolation and other statistical calculations for critical values and cumulative probability values of different important distributions in statistics.
- The software is able to analyze around 20 hypothesis tests for different number of samples, sample sizes, data types, data distributions, etc.
- The software is based on a layman approach where the user need not have any programming background with only adequate statistical skills.
- The software is excellent for visualizing the nature or the trend in the data that is otherwise hard to comprehend and takes a lot of time for any researcher to manually program, graph and plot.
- To do that, the software utilizes a number of graphical tools based on the nature of the data and detailed tables for parameters.
Key features:
Hypothesis tests have been categorized into single sample hypothesis test, 2 or more sample hypothesis tests and hypothesis test with binomial/poisson distribution.
Single sample hypothesis tests: Includes t-distribution test for both one tail and two tail analysis in case of sample size less than 30 and z-distribution test in case of sample size greater than 30.
Two or more sample hypothesis tests: : Involves two or more samples with paired-unpaired datasets, with normal distributed data, ordinal data and dichotomous data and for both one and two tail analysis. Tests included are paired ‘t’ test, unpaired ‘t’ test, wilcoxon signed rank test, wilcoxon rank sum test, Mc Nemar test, Chi-square Fischer exact test, Repeated measures ANOVA, One way ANOVA, Friedman test, Kruskal Wallis test, Cochran Q test and Chi-square test.
Association tests can be performed for normally distributed data, ordinal data and dichotomous data. Tests included are Pearson correlation, Spearman’s rank correlation and Contingency coefficient tests (Karl pearson’s coefficient of contingency and Tschprow’s coefficient of contingency).
Hypothesis test with binomial / poisson distribution: Involves binomial / poisson parameters for sample and population data for less than or greater than null probability conditions.
Regression analysis / Curve fitting: Includes polynomial regression (linear, quadratic, cubic or upto ‘n’ degrees preferably below 8), exponential regression and logarithmic regression.
Polynomial Interpolation: Includes polynomial interpolation with ‘n’ number of data (preferably upto 8 data points).
Statistical calculator serves as a dedicated tool in the software which performs evaluation of critical value and cumulative probability values for z-distribution, student t-distribution, chi square distribution, F-distribution, gamma calculation, binomial and poisson calculations.
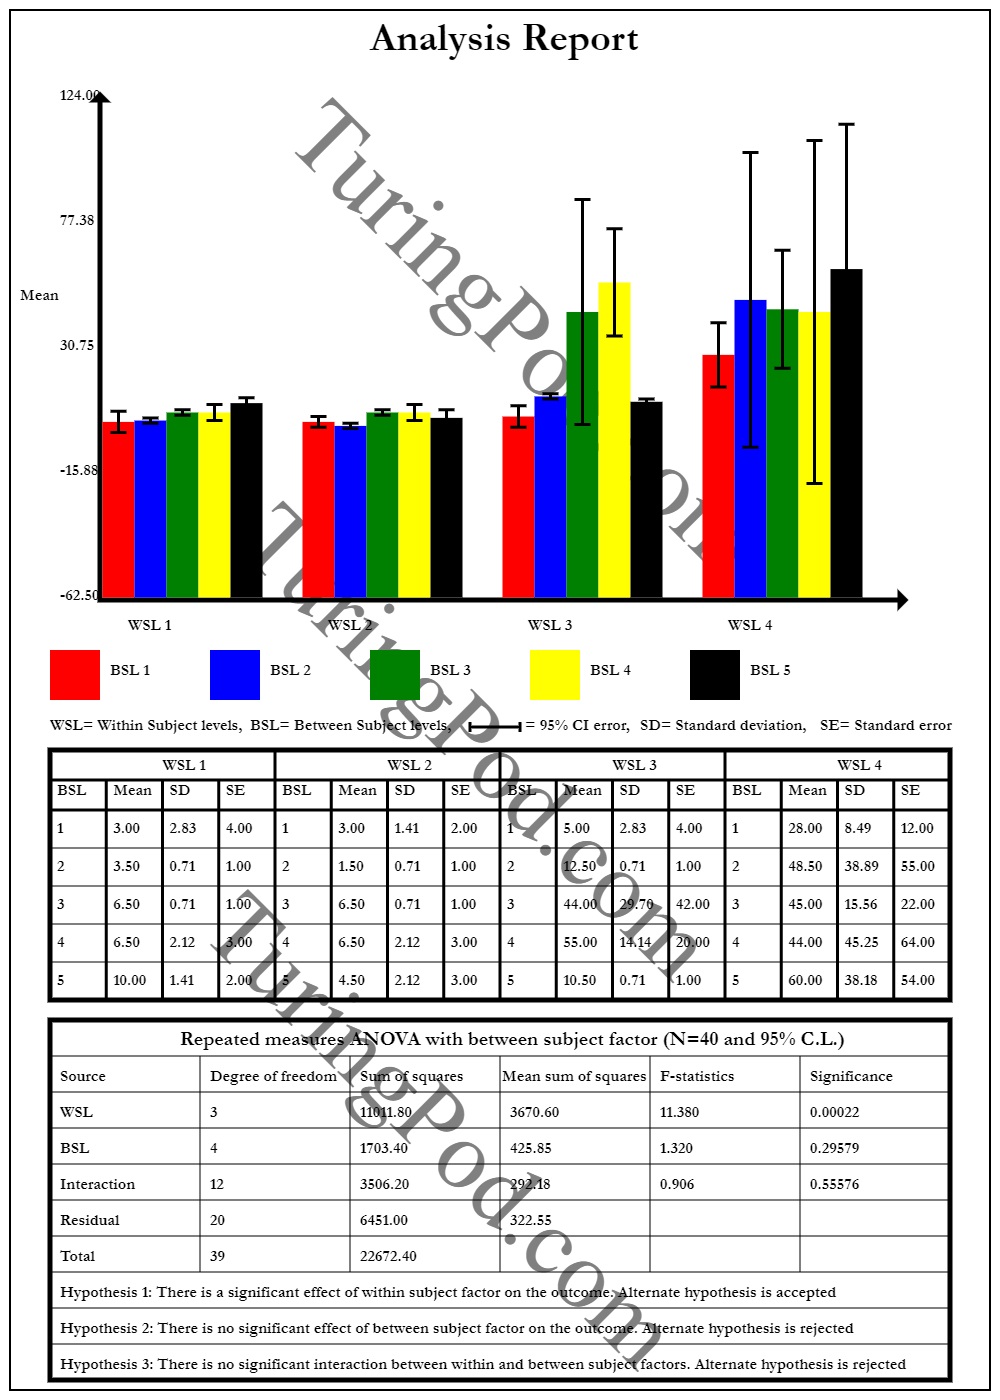
Repeated measures ANOVA, Source: Smart Statistics output generation
Manual:
Selection of task
- Login with your email id and password and then register for free trial. Click on the ‘continue free trial’ button below and you will be re-directed to the software.
- After successful redirection to the software, you are ready to carry out your statistical analysis. From the dropdown list, select the task that is needed to be performed on your data. The tasks include hypothesis test for one sample, hypothesis test for 2 or more samples, hypothesis test with binomial/poisson distribution, regression/ curve fit, polynomial interpolation and statistical calculator.
- After selecting from the list click ‘Proceed’.

Hypothesis test for 1 sample
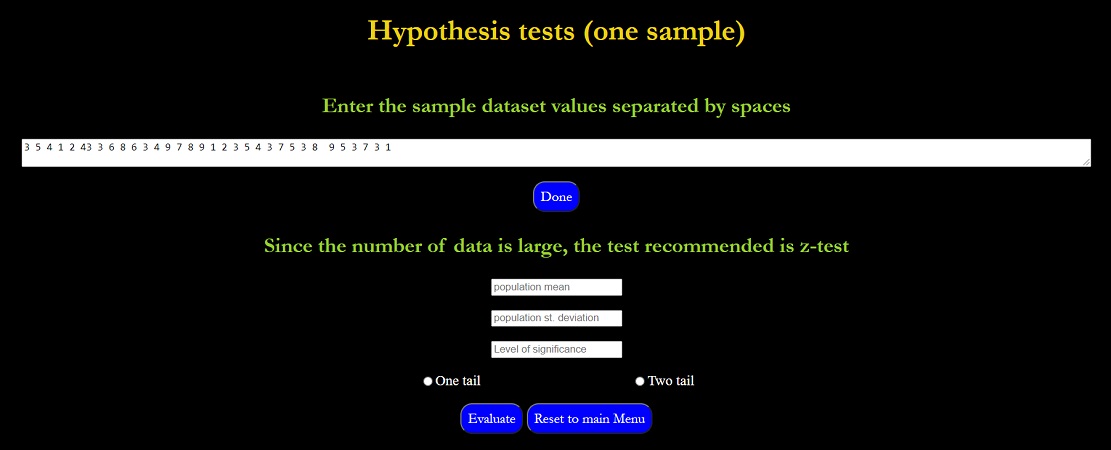
- Upon selecting the ‘hypothesis test (1 sample)’ option from the ‘select task’ dropdown list, a new input box is displayed where you need to enter your numeric sample data into the ‘dataset’ field. The numeric data values must be separated by ‘spacebar’. Separation by ‘comma’ or other characters may yield no results.
- If the sample size is below 30, t-hypothesis test will be recommended by the software and input fields for population mean, level of significance and buttons for selecting one or two tail analyses will be displayed. After the entries are made, the user can press the ‘Evaluate’ button for the final generation of the report in the form of graphical tools and tables.
- For sample size greater than 30, you are required to enter an additional field value of population standard deviation apart from population mean, significance level and tail analyses buttons. After entering into all the fields press the ‘Evaluate’ button for the final generation of the report in the form of graphical tools and tables.
Note: In case of input errors, it will be communicated to the user in the form of red colored texts.
Hypothesis/association test for 2 or more sample
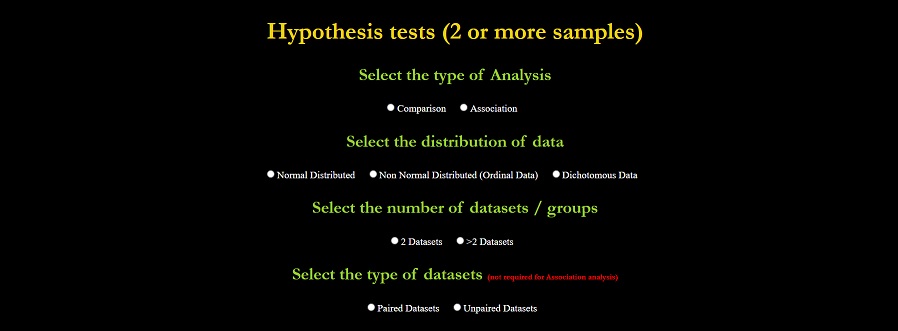
- If the ‘Hypothesis / association test (2 or more samples)’ option is selected from the ‘Select task’ dropdown list, the user will be redirected to a set of questionnaires regarding the nature of the data, type of analysis, number and the type of datasets. The user is needed to fill all the required inputs and press ‘Proceed’.
- Based on the inputs from the user, the software will recommend the hypothesis tests that is to be performed among the tests that have already been mentioned in the previous section.
- The user needs to fill the dataset fields with values separated by ‘spacebar’ and the value for significance level must be entered between 0 and 1.
- In case the user makes any error in data input process, corrections in red text will be displayed above the 'Evaluate' button. After making all the entries, the users can finally press the ‘Evaluate’ button for the final generation of the report in the form of graphical tools and tables.
Note: In case of association test, the type of dataset is generally not required to be filled.
Note: Also for association test with normally distributed and ordinal data distribution, both number and type of dataset entries are not required to be filled.
Note: The dataset values must be entered column-wise as in the standard systems.
Note: The dataset values in case of ‘Cochran Q test’ must be in 0’s and 1’s as it is meant for dichotomous data.
Note: The datasets for Mc-Nemar test and Chi-square Fischer test must not contain more than two values / entries.
Hypothesis test with binomial / poisson distribution
- If ‘Hypothesis test (binomial / poisson)’ option is selected from the ‘Select task’ dropdown list, a screen is displayed where binomial / poisson parameters need to be entered after which the ‘Evaluate’ button can be pressed and the final report can then be generated.
Regression / curve fit
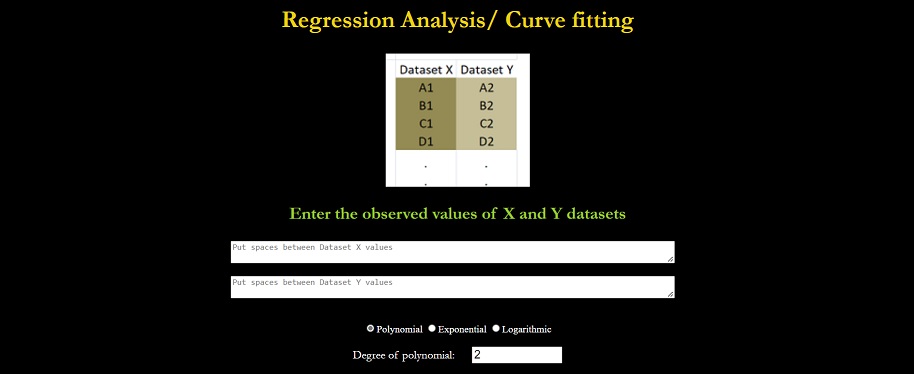
- Upon selecting ‘Regression / curve fit’ option from the ‘Select task’ dropdown list, the user will have to enter values into the X-Y dataset fields and select the desired regression model (polynomial, exponential or logarithmic). In case of the polynomial model, the degree of polynomial has to be entered with ‘1’ degree representing linear regression, ‘2’ representing quadratic regression, ‘3’ representing cubic regression and so on. In case of logarithmic and exponential models, no other parameter is required.
- If everything is perfectly entered, the user can press on the ‘Evaluate’ button to obtain the final graphical and tabulated report along with the regression equation.
Polynomial interpolation
- In case of ‘Polynomial interpolation’ option selected from the ‘Select task’ dropdown list, the user will be directed to enter the X-Y dataset values. The user can then press the ‘Evaluate’ button for the final graphical and tabulated report along with the interpolation equation.
Statistical calculator
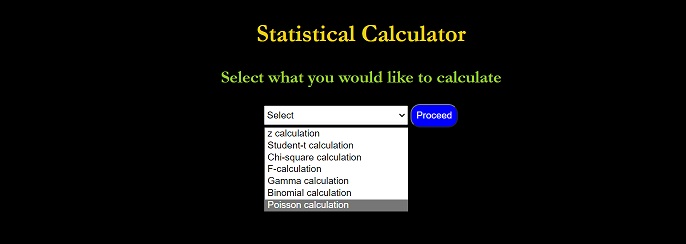
- After selecting the ‘statistical calculator’ option from the ‘Select task’ dropdown list, a new dropdown list is displayed where the user can select the distribution type that is required to be calculated. Upon selecting these options as also mentioned in the previous section, the user needs to choose whether to calculate the critical value or the cumulative probability value. Upon successful entries of all the fields including the degree of freedoms, the user can then hit the ‘Calculate’ button.
Users are most welcome to provide any reviews / suggestions / recommendations to further improve the software
"Dont let statistics be the burden in your journey of research"
Developer


